1
 →
→
Local-first desktop widget for tracking token usage, costs, and limits across 43+ AI coding tools—including Claude Code, Codex, Cursor, OpenCode, OpenClaw, and more—with multi-device sync.
Javis603/token-monitor is an open-source project on GitHub, mainly written in JavaScript. Local-first desktop widget for tracking token usage, costs, and limits across 43+ AI coding tools—including Claude Code, Codex, Cursor, OpenCode, OpenClaw It currently holds 2,521 stars and 250 forks with 124 open issues, and was last pushed on 2026-09-30 (repository created 2026-05-19).
Git Homed tracks it on the Today's Trending board, currently at rank #89 with 37 new stars today.

One live dashboard for every AI coding tool, synced across every machine.






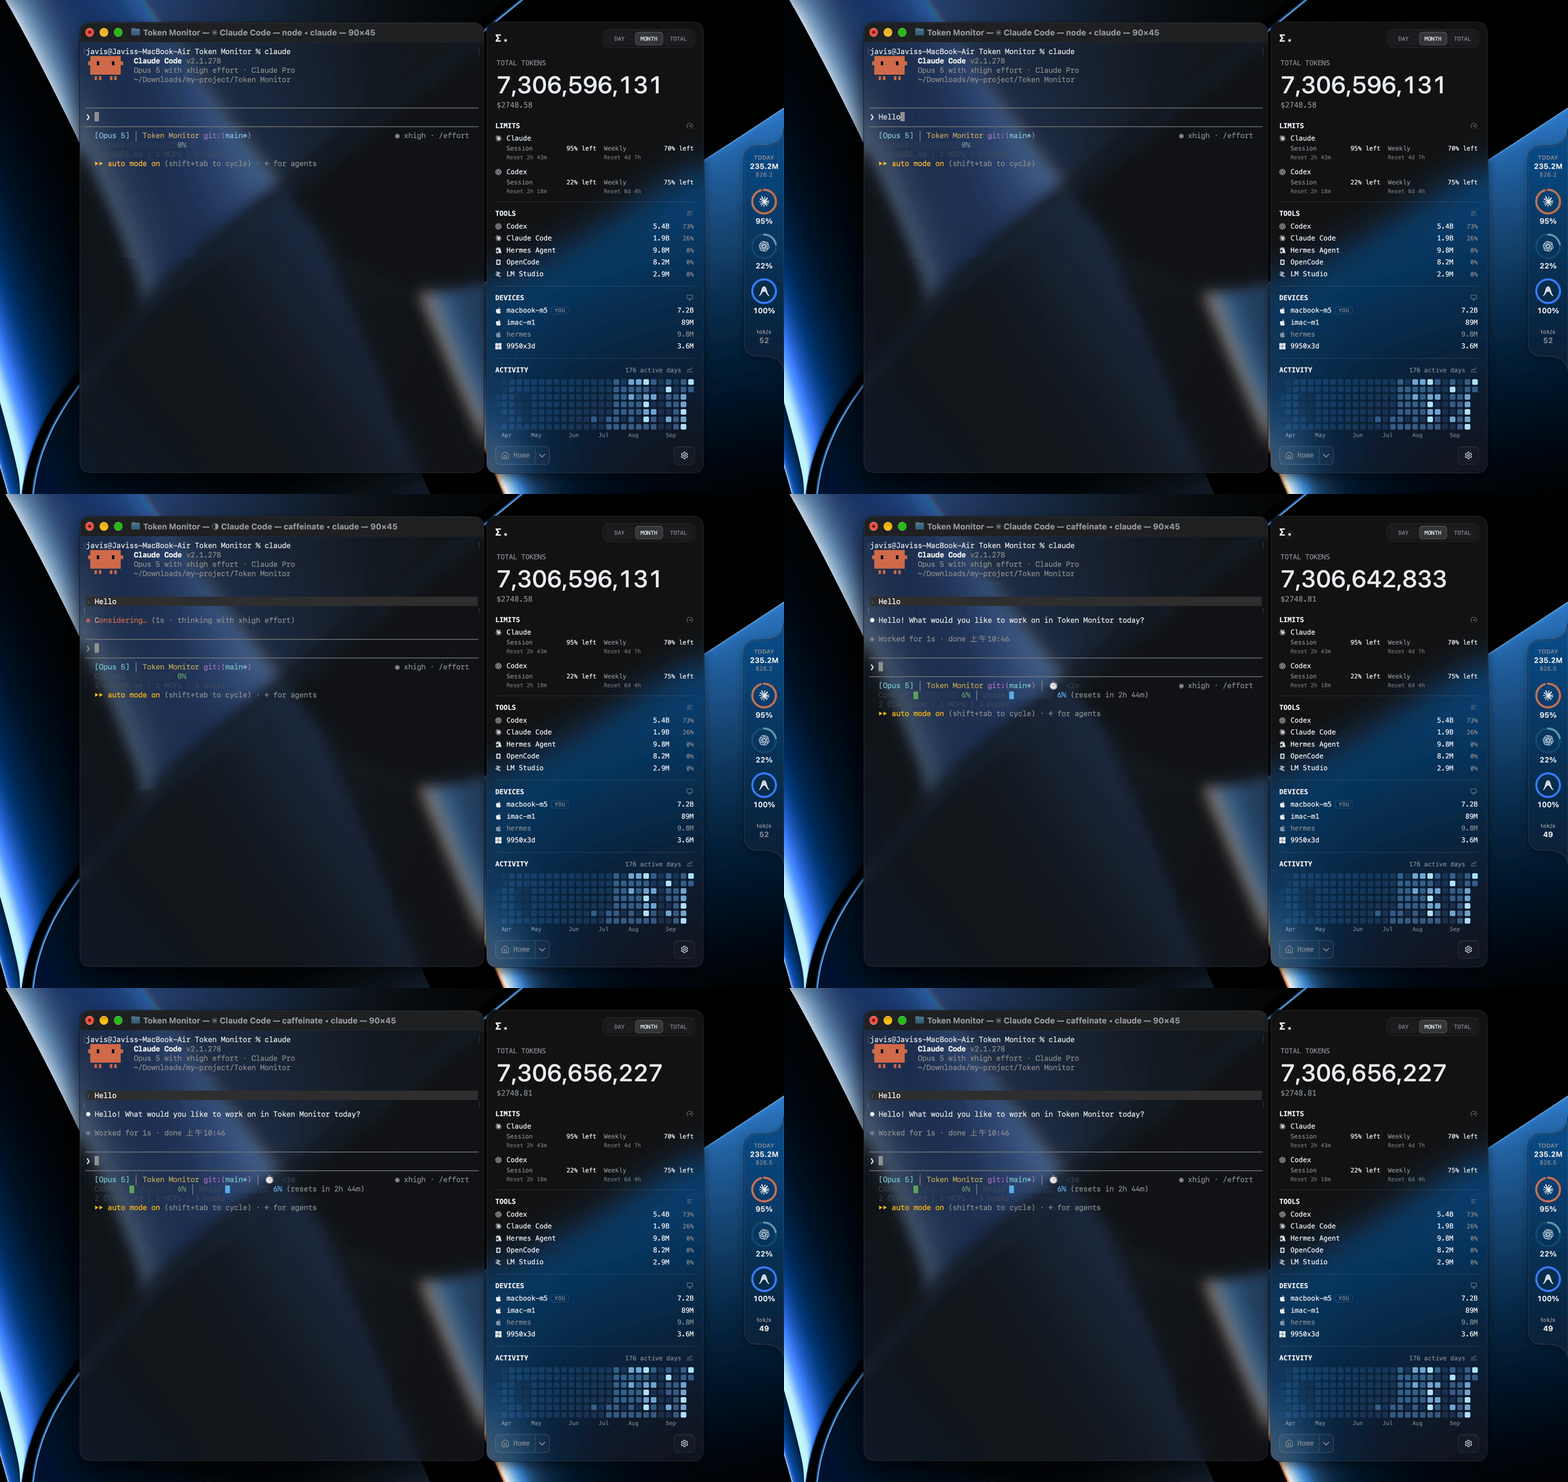
A desktop widget that shows live token usage and AI Tool Limits across 43+ AI coding tools — Claude Code, Codex, Cursor, GitHub Copilot, Cherry Studio, and more — with real-time multi-device sync, historical usage trends, and breakdowns by tool, device, model, session, or project.
Token Monitor supports token usage, account-limit checks, and session details separately:
| Logo | Tool | Data path | Token Usage | AI Tool Limits | Session Details |
|:---:|------|-----------|:---:|:---:|:---:|
|  | Claude Code |
 ~/.claude/projects/, ~/.claude/transcripts/ | ✅ | ✅ | ✅ |
|  | Codex |
 ~/.codex/ (sessions/, archived_sessions/) | ✅ | ✅ | ✅ |
|  | OpenCode |
 ~/.local/share/opencode/ (opencode*.db, storage/message/) | ✅ | ✅ | ✅ |
|  | Hermes Agent |
 ~/.hermes/state.db | ✅ | — | — |
|  | OpenClaw |
 ~/.openclaw/agents/ | ✅ | — | — |
|  | Cursor IDE / Cursor CLI / Grok Bot |
 ~/.config/tokscale/cursor-cache/ (account-level usage export) | ✅ | ✅ | — |
|  | Antigravity |
 ~/.gemini/ (antigravity/, antigravity-ide/, antigravity-backup/, antigravity-cli/conversations/) | ✅ | ✅ | — |
|  | Cline | VS Code globalStorage tasks (
.../saoudrizwan.claude-dev/tasks/), ~/.cline/data/sessions/ | ✅ | ✅ | — |
|  | Amp |
 ~/.local/share/amp/threads/ | ✅ | — | — |
|  | Factory Droid |
 ~/.factory/sessions/ | ✅ | ✅ | — |
|  | Kimi CLI / Kimi Code / Kimi Work |
 ~/.kimi/sessions/, ~/.kimi-code/sessions/, /kimi-desktop/ | ✅ | ✅ | — |
|  | Qwen CLI |
 ~/.qwen/projects/ | ✅ | — | — |
|  | Grok Build |
 ~/.grok/ (sessions/, logs/unified.jsonl) | ✅ | ✅ | — |
|  | GitHub Copilot | VS Code
 workspaceStorage/*/chatSessions/, ~/.copilot/ (otel/, data.db, session-store.db) | ✅ | ✅ | — |
|  | Pi |
 ~/.pi/agent/sessions/ | ✅ | — | — |
|  | Oh My Pi |
 ~/.omp/agent/sessions/ | ✅ | — | — |
|  | Zed |
 ~/.local/share/zed/threads/threads.db | ✅ | ✅ | — |
|  | Kilo |
 ~/.local/share/kilo/kilo.db; VS Code globalStorage tasks (.../kilocode.kilo-code/tasks/) — extension logs on Linux & remote/WSL only | ✅ | — | — |
|  | Command Code |
 ~/.commandcode/projects/**/*.jsonl | ✅ | ✅ | — |
|  | MiMo Code / MiMo Desktop |
 ~/.local/share/mimocode/mimocode.db | ✅ | ✅ | — |
|  | Muse Code |
 ~/.local/share/muse/sessions/ | ✅ | — | — |
|  | ZCode / GLM |
 ~/.zcode/ (projects/, cli/db/db.sqlite) | ✅ | ✅ | — |
|  | Kiro |
 ~/.kiro/sessions/cli/, Kiro IDE globalStorage & kiro-cli DB | ✅ | ✅ | — |
|  | CodeBuddy |
 ~/.codebuddy/projects/ + IDE / VS Code extension logs | ✅ | — | — |
|  | WorkBuddy |
 ~/.workbuddy/projects/, ~/.workbuddy/workbuddy.db | ✅ | ✅ | — |
|  | Proma |
 ~/.proma/agent-sessions/*.jsonl | ✅ | — | — |
|  | Qoder |
 ~/.qoder-cn/projects/**/*.jsonl, legacy /QoderCN/SharedClientCache/cache/db/local.db (CN only) | ✅ | ✅ | — |
|  | Reasonix |
 ~/.reasonix/ (stats/, sessions/, projects/*/sessions/) | ✅ | — | — |
|  | DeepSeek / DeepSeek Harness |
 ~/.dsh/sessions/ (session.jsonl, session.jsonl.zstd) | ✅ | ✅ | ✅ |
|  | Cherry Studio |
 /CherryStudio/ (Data/Agents/.claude/projects/ V2, .claude/projects/ legacy) | ✅ | — | — |
|  | LM Studio |
 ~/.lmstudio/server-logs/**/*.log | ✅ | — | — |
|  | Unsloth Studio |
 ~/.unsloth/studio/studio.db | ✅ | — | — |
|  | Devin CLI / Devin Desktop |
 ~/.local/share/devin/cli/sessions.db, /Devin/User/acp-events/ | ✅ | ✅ | — |
|  | fx |
 ~/.fx/sessions/ | ✅ | — | — |
|  | TypeSafe | TypeSafe Console Cookie (billing balance and estimated token spend via usage data) | — | ✅ | — |
|
| TypeSafe | TypeSafe Console Cookie (billing balance and estimated token spend via usage data) | — | ✅ | — |
|  | OpenRouter | OpenRouter API key (usage/key limit; balance when credits access is authorized, documented for Management keys) | — | ✅ | — |
|
| OpenRouter | OpenRouter API key (usage/key limit; balance when credits access is authorized, documented for Management keys) | — | ✅ | — |
|  | Minimax | Minimax API key (Token Plan quota via Minimax API) | — | ✅ | — |
|
| Minimax | Minimax API key (Token Plan quota via Minimax API) | — | ✅ | — |
|  | Volcengine | Ark API key or Volcengine AK/SK (Ark Coding Plan & Agent Plan quota via Volcengine API) | — | ✅ | — |
|
| Volcengine | Ark API key or Volcengine AK/SK (Ark Coding Plan & Agent Plan quota via Volcengine API) | — | ✅ | — |
|  | Ollama | Ollama Cloud cookie (session/weekly usage via ollama.com/settings) | — | ✅ | — |
|
| Ollama | Ollama Cloud cookie (session/weekly usage via ollama.com/settings) | — | ✅ | — |
|  | Trae CN | Trae CN access token (Trae CN / SOLO credits via trae.cn) | — | ✅ | — |
|
| Trae CN | Trae CN access token (Trae CN / SOLO credits via trae.cn) | — | ✅ | — |
|  | Alibaba Cloud | Alibaba Cloud console cookie (Bailian / Model Studio Token Plan quota, Team & Personal) | — | ✅ | — |
|
| Alibaba Cloud | Alibaba Cloud console cookie (Bailian / Model Studio Token Plan quota, Team & Personal) | — | ✅ | — |
|  | StepFun | StepFun Oasis-Token (Coding Plan / Token Plan quota) | — | ✅ | — |
|
| StepFun | StepFun Oasis-Token (Coding Plan / Token Plan quota) | — | ✅ | — |
|  | Third-party APIs | New API / Sub2API-compatible account presets (including compatible One API forks), a New API API-key preset, and a Custom balance endpoint | — | ✅ | — |
$XDG_DATA_HOME for the ~/.local/share/ roots, and per-tool variables such as $CODEX_HOME, $GROK_HOME, $HERMES_HOME, $KIMI_CODE_HOME, $UNSLOTH_STUDIO_HOME, $LM_STUDIO_HOME, $DSH_HOME, $REASONIX_STATE_HOME, $REASONIX_HOME and the $CLINE_* family./v1/chat/completions and /v1/responses requests recorded in server logs. Conversations started from LM Studio's built-in Chat UI and native /api/v1/chat requests are not included.studio.db: Studio chats and its local API. Local inference has zero API cost; recognized metered providers use Tokscale's price estimates. Training tokens are not included. See Unsloth source notes.sessions.db and Devin Desktop agent sessions from acp-events ACP logs; where both cover the same session the CLI database is authoritative. Desktop coverage depends on the connected ACP agent: only agents that write usage_update events locally are counted, and Devin Desktop's default devin-cloud agent meters its usage server-side, so a default Desktop setup reports no Desktop tokens. Session titles and project attribution come from the CLI database. See Devin source notes.Qoder CN token usage is read from the app's local data, not an API — enable it in Settings → tools (opt-in, off by default). Current builds persist Claude-compatible JSONL transcripts in the Qoder config directory's projects tree (normally ~/.qoder-cn/projects), while older builds wrote a SQLite database. The adapter reads both. The transcript path follows TOKEN_MONITOR_QODER_CN_PROJECTS_PATH, then QODERCN_CONFIG_DIR/projects, then the default; the legacy database is auto-detected per platform and can be overridden with TOKEN_MONITOR_QODER_CN_DB_PATH. See Qoder source notes.
This is an advanced local integration: the JSONL path needs no extra runtime, but reading the legacy database needs a sqlite3 CLI on PATH or a Node runtime with unflagged node:sqlite (Node ≥ 22.15; the Electron widget may need the CLI). Read failures retain the last complete snapshot. Only JSONL rows with reported token counts are included: current first-party plan-billed rows may expose credits and context occupancy but no reliable per-session context window, so their tokens cannot be reconstructed safely and are omitted from token totals. Their credits remain available in AI Tool Limits; BYOK/custom-model rows with measured tokens are counted normally.
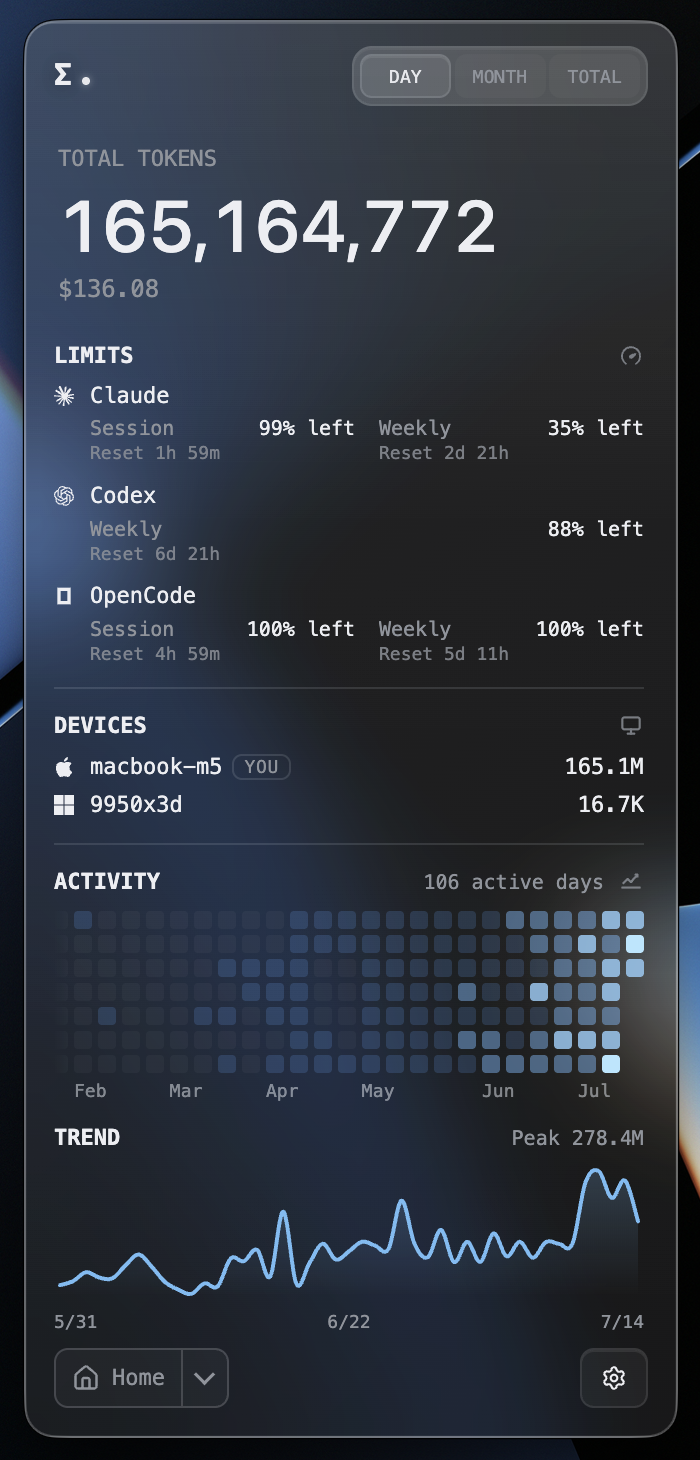 Customizable dashboard — choose which modules show and their order |
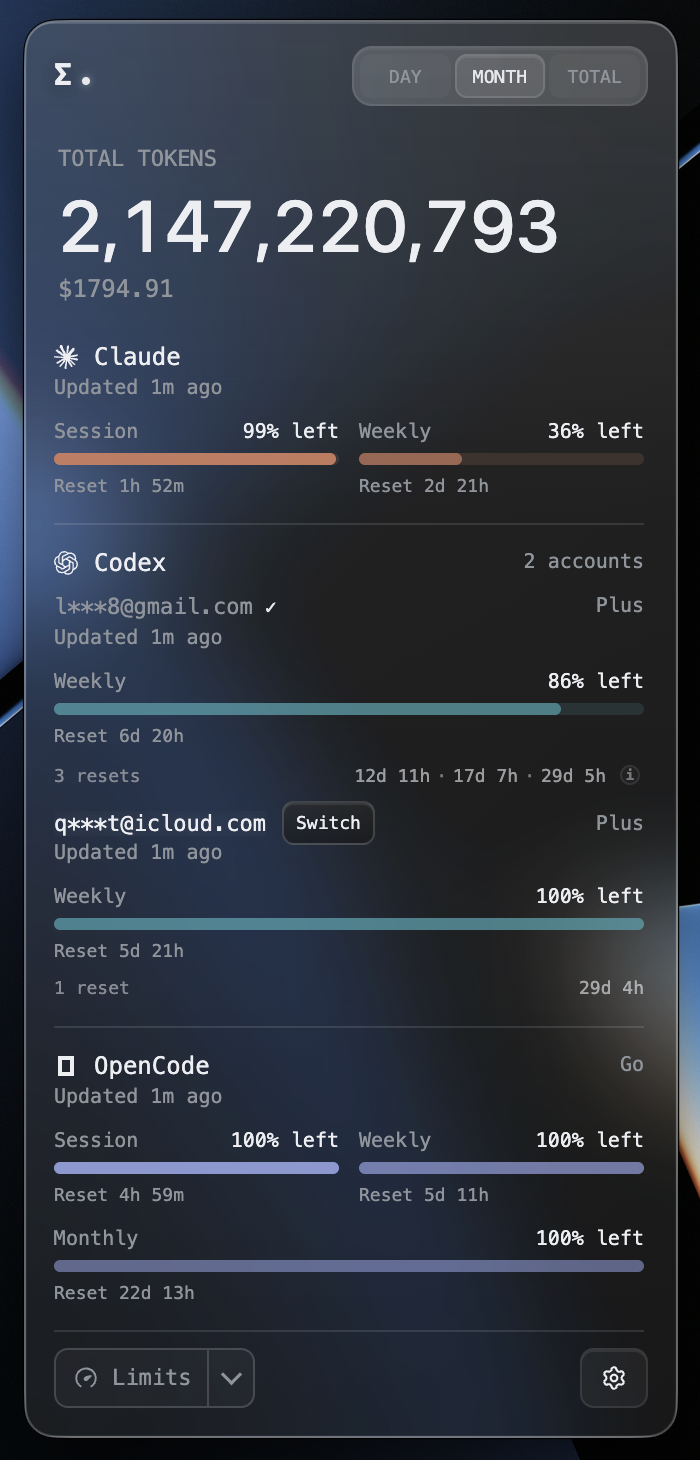 Multiple accounts side by side, one-click switch of the active Codex account |
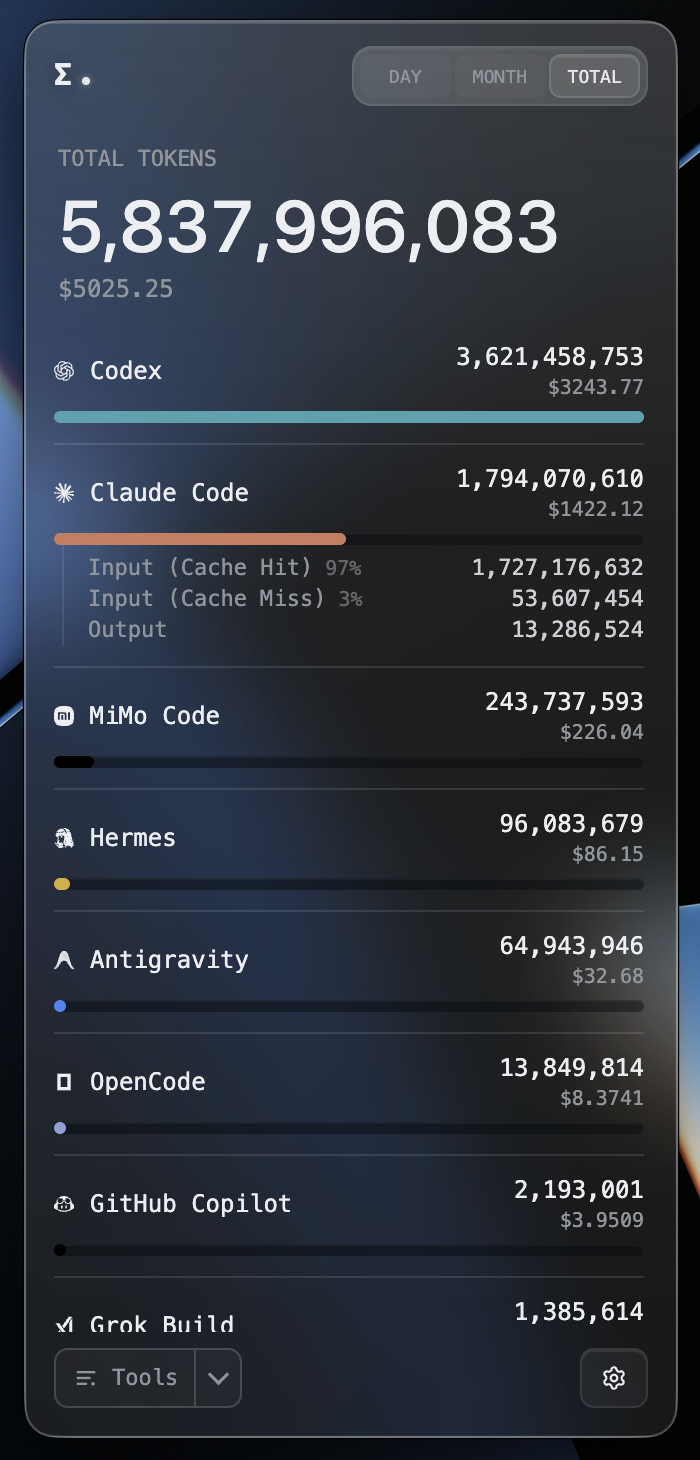 Click any tool to expand input / output and cache-hit detail |
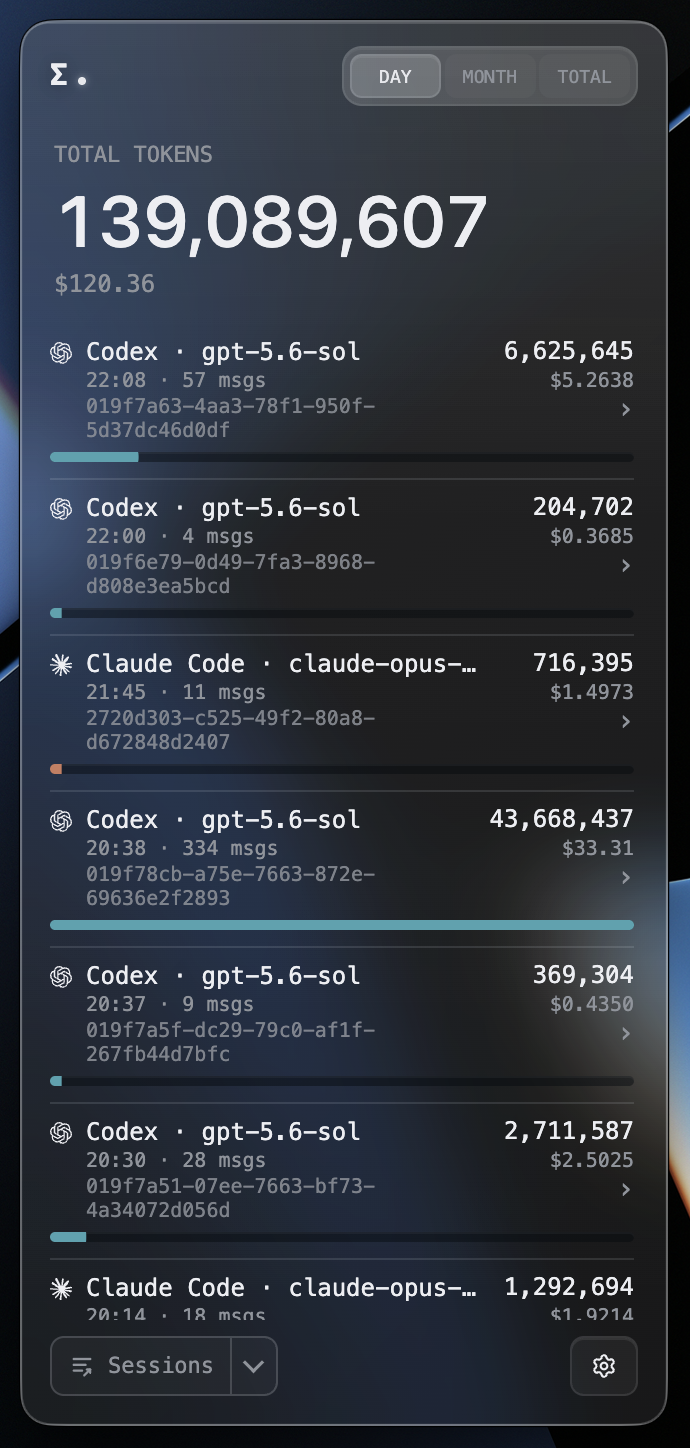 Open a single session to break each prompt into tokens and tools used |
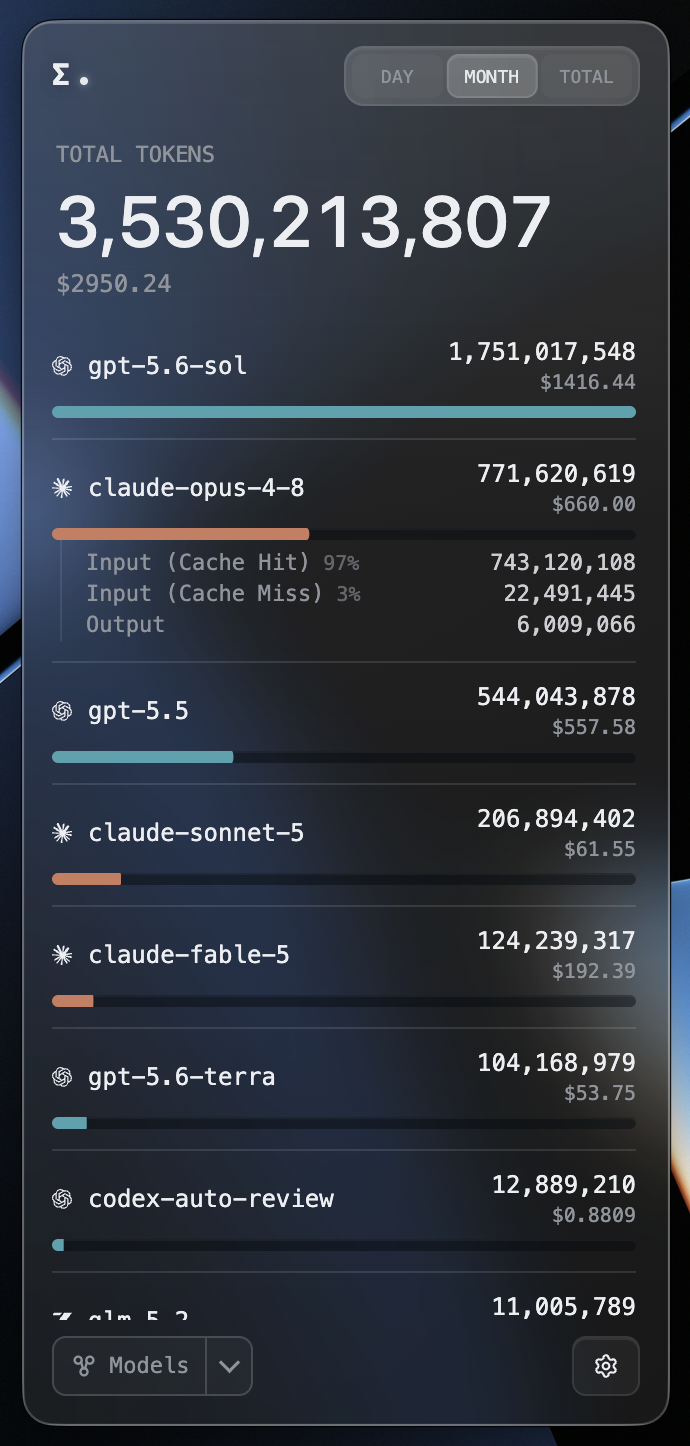 Every model's usage and cost, aggregated across tools |
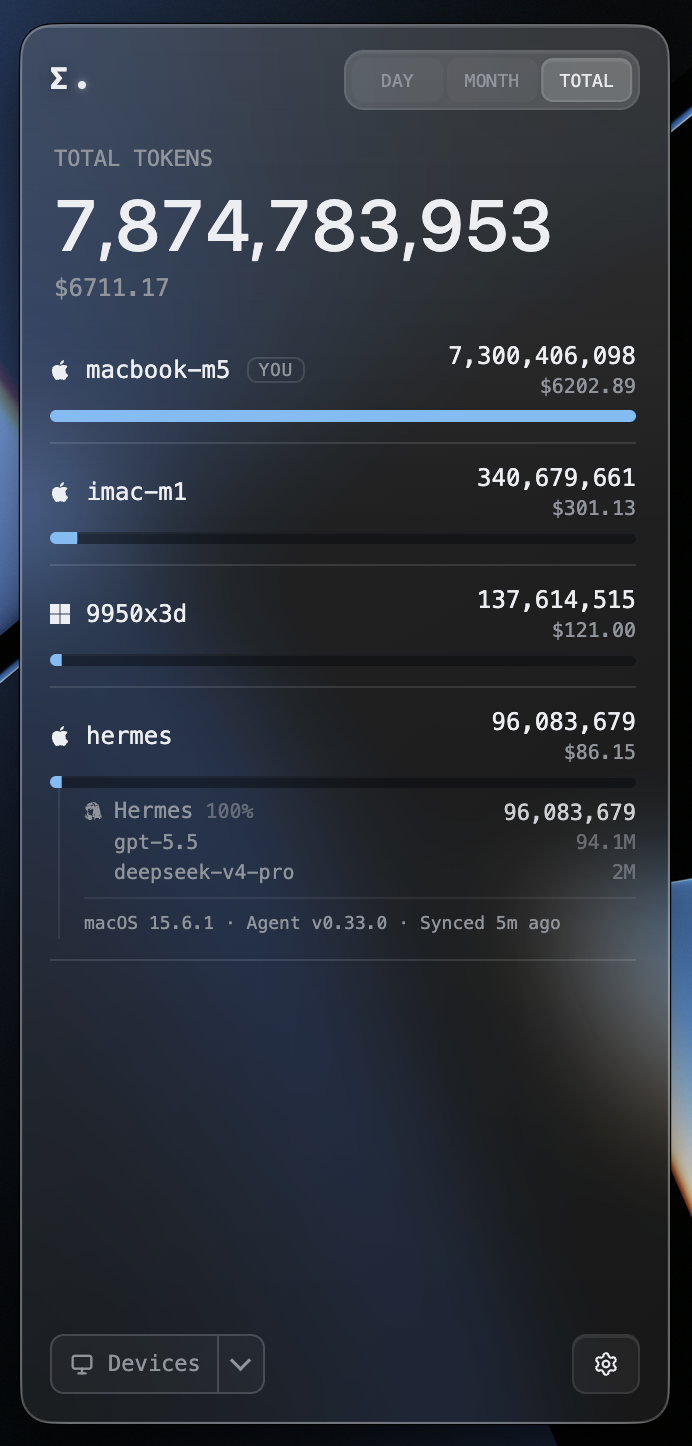 Each device's usage, cost, and sync status — expand for per-machine detail |
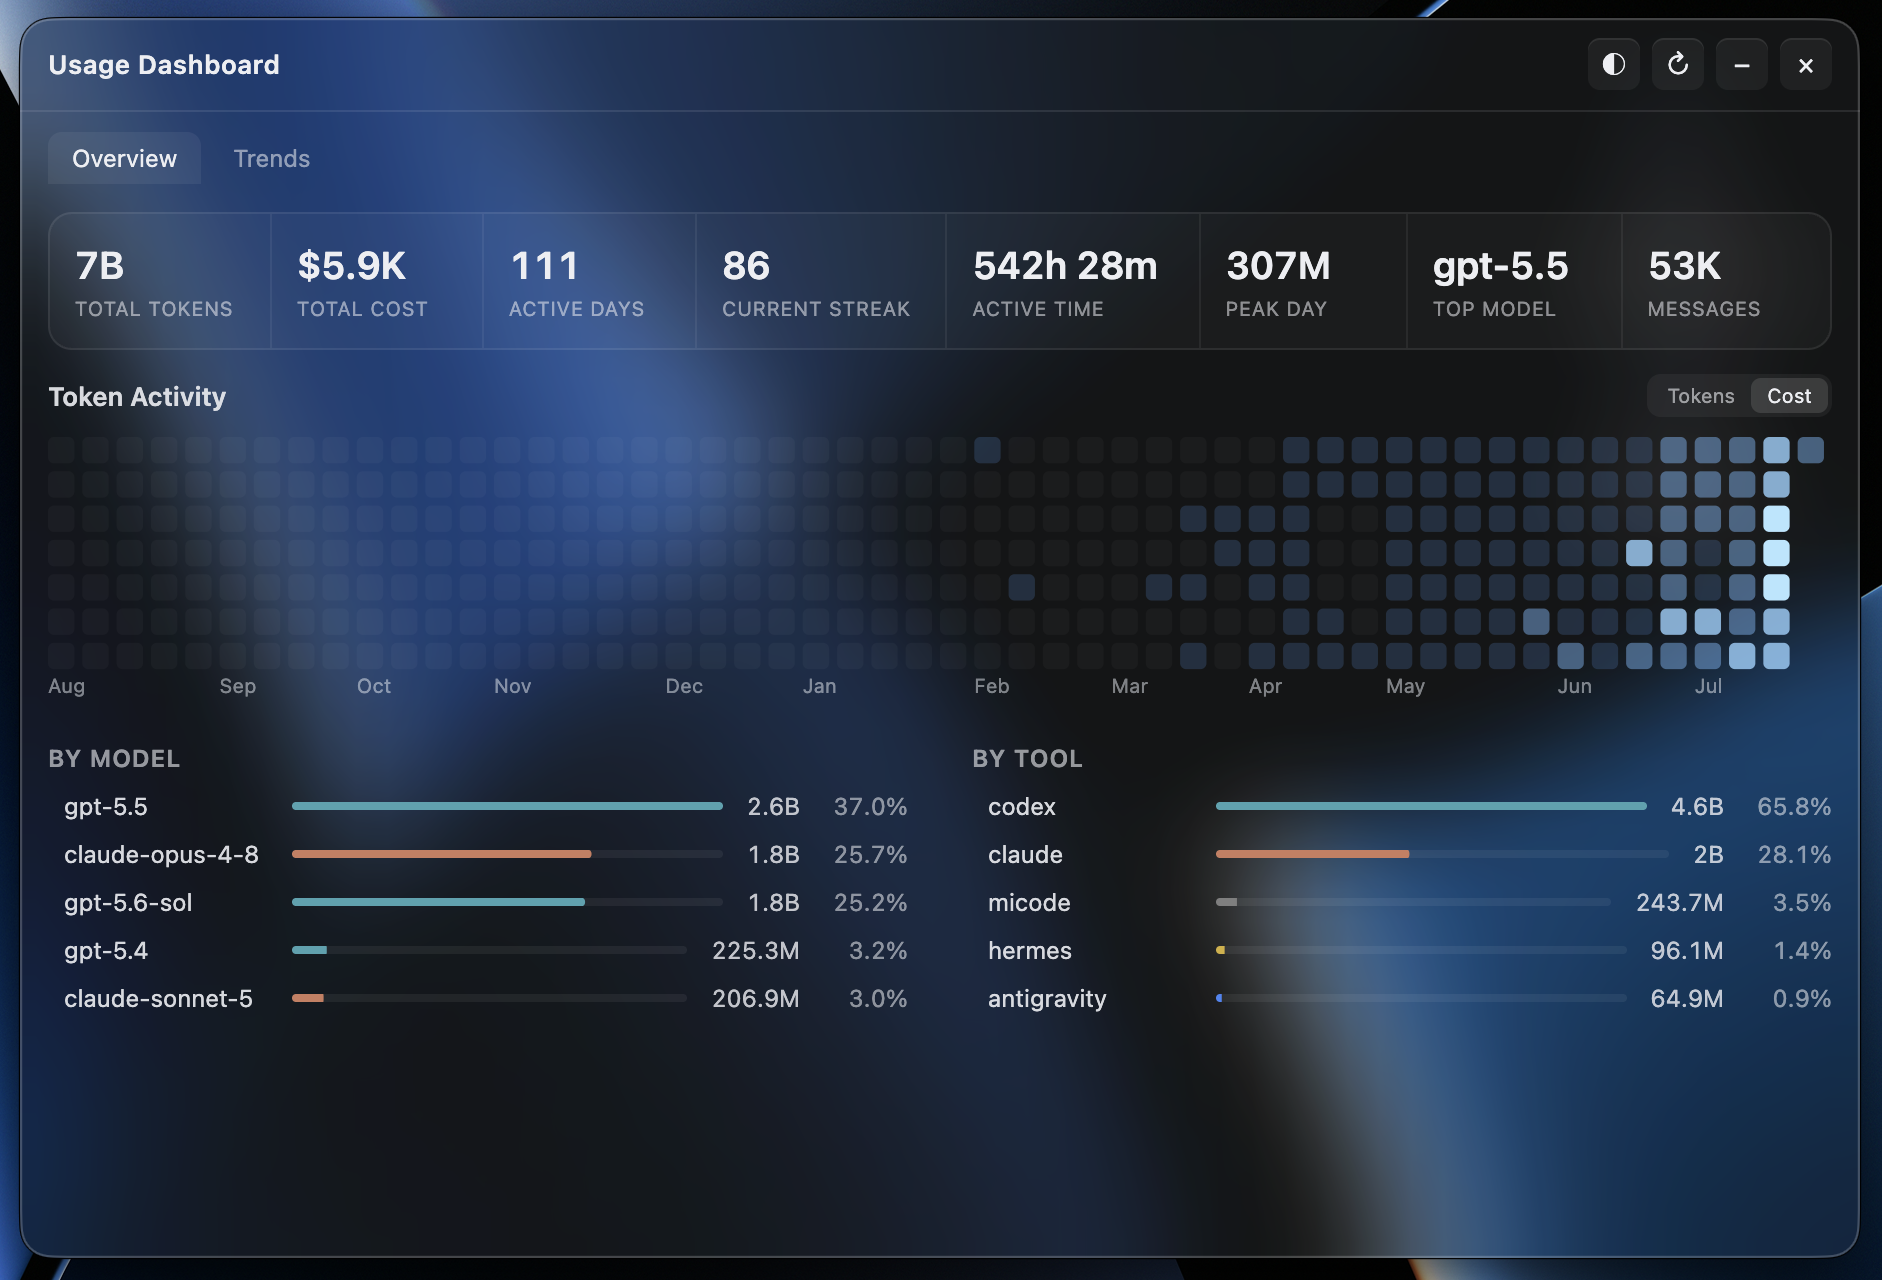 A year of activity heatmap and streaks, aggregated across all devices |
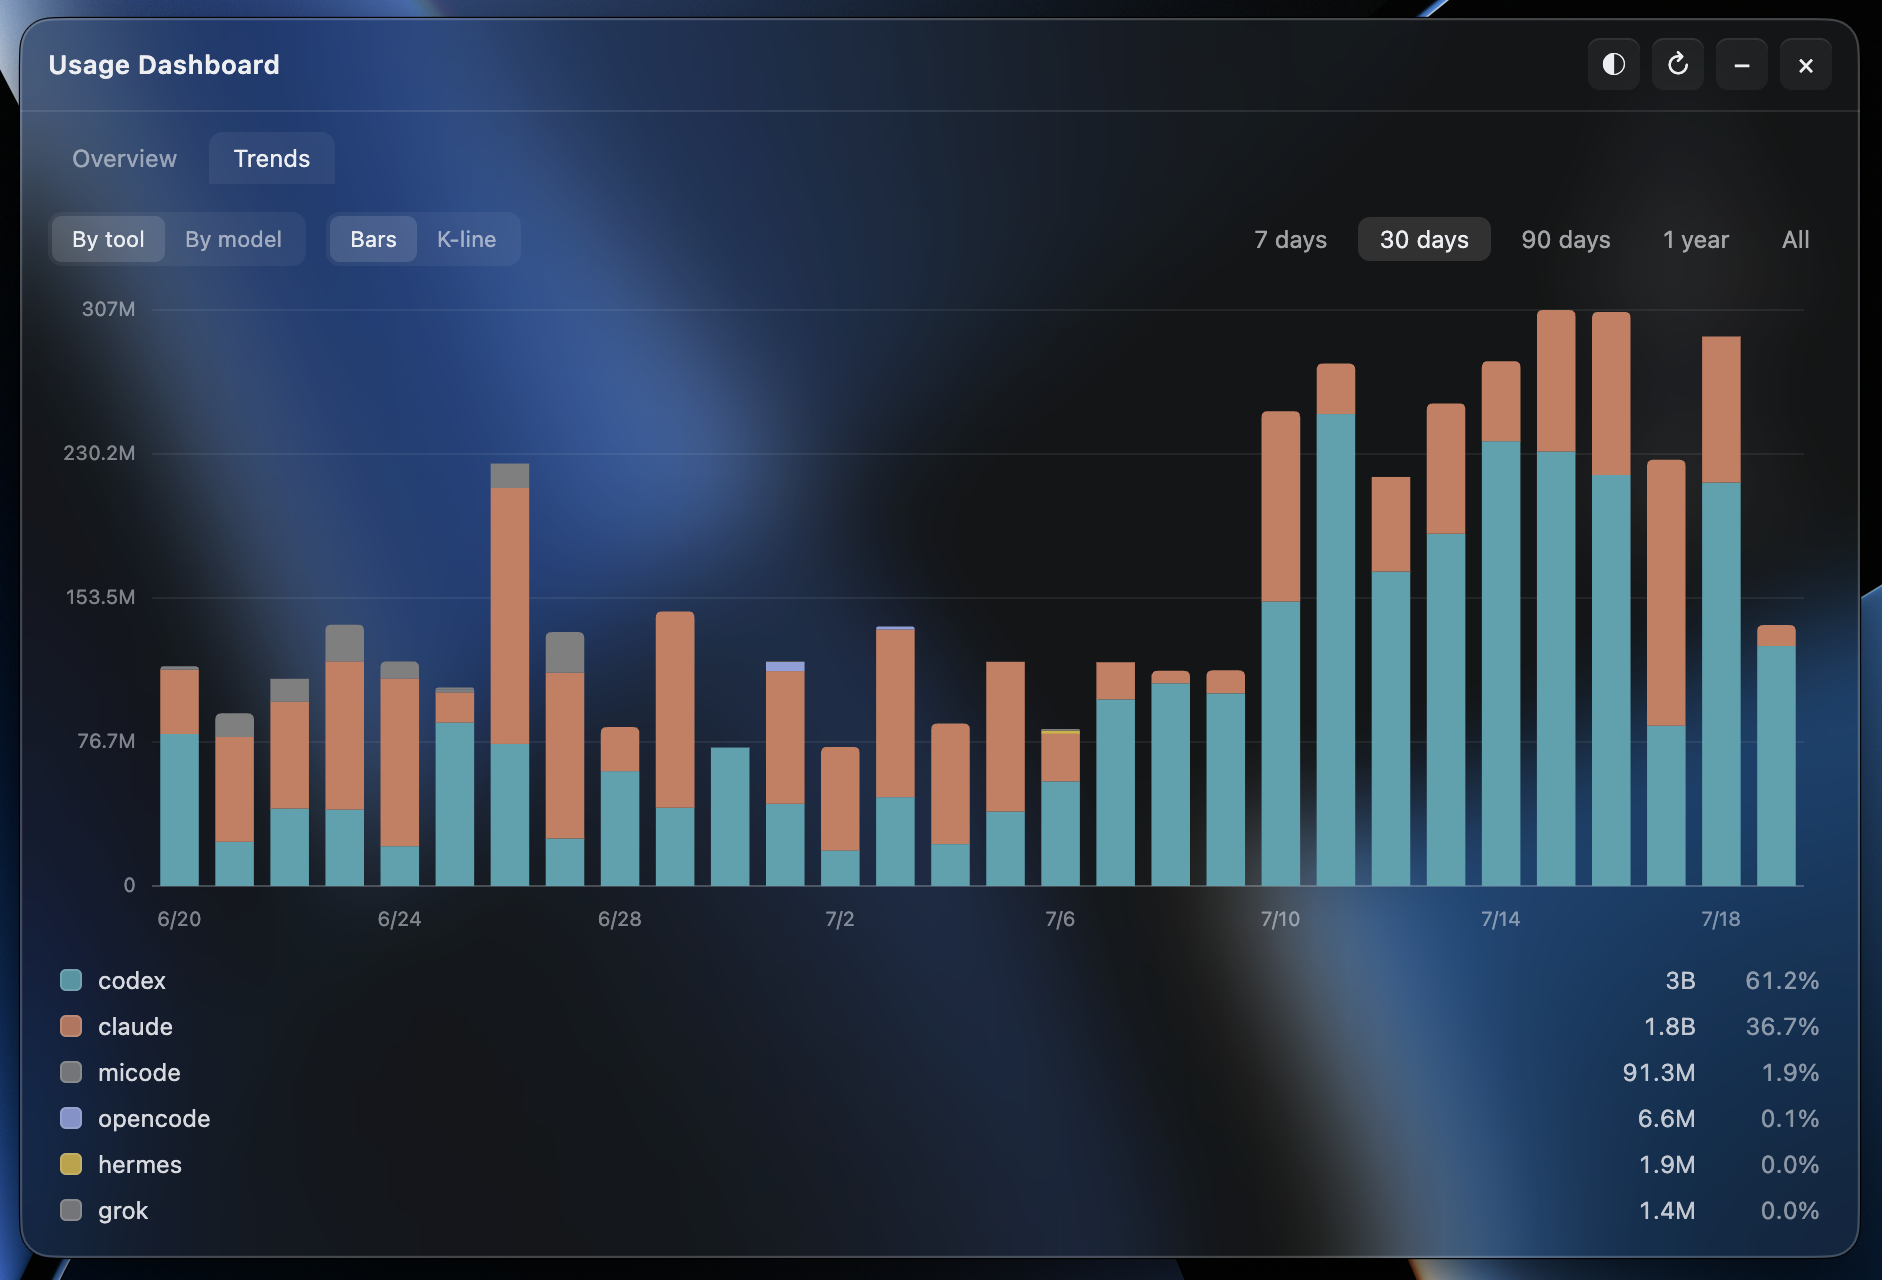 A year of daily trends, stacked by tool / model, with K-line |
Most usage monitors are useful on the machine they run on. Token Monitor is built for multi-device work: each device watches its own local logs, sends summary updates to your hub, and every connected widget sees token changes almost immediately.
tok/s or total burn in tok/minOn macOS, install through the official Homebrew Cask:
brew install --cask token-monitor
Or download from GitHub Releases.
.dmg, signed and notarized.dmg, signed and notarized.exe, code-signed.AppImageLocal mode is the default: launch the app and it starts tracking this device. No hub, agent, or config required.
Pick ONE multi-device sync backend for your devices (and any headless agents). On each device, open the widget and pick a mode under Settings → Multi-device Sync. The widget contributes this device's usage automatically; run npm run agent only on machines without a widget. iCloud Drive is a macOS-widget-only option and does not support headless agents.
In the widget on one always-on machine, open Settings → Multi-device Sync and pick Host hub on this device. The widget generates a random secret and lists the LAN URLs other devices can connect to (Tailscale or ZeroTier addresses appear here too). On every other device, pick Connect to a hub and paste the URL + secret.
The hub runs while Token Monitor is running — quitting (not just closing the window) stops it for all connected devices.
# on the always-on machine
cp .env.example .env
set TOKEN_MONITOR_SECRET to something private, then:
npm run hub

One-click deploy — Cloudflare will prompt for the TOKEN_MONITOR_SECRET during setup. Or deploy manually:
cd worker
npm install
npx wrangler login
npx wrangler secret put TOKEN_MONITOR_SECRET
npx wrangler deploy
Paste the deployed URL into each device's widget at Settings → Multi-device Sync. See worker/README.md for the iOS widget recipe and endpoint reference, or docs/API.md for the hub HTTP API.
On each Mac signed into the same Apple ID, choose iCloud Drive in Settings → Multi-device Sync. This is an opt-in macOS-only path: Token Monitor writes one atomic snapshot per device and one subscription snapshot per writer under iCloud Drive/Token Monitor/sync-v1/, then each Mac aggregates the valid files locally. It uses no Token Monitor server, CloudKit, or credentials; provider API keys, cookies, and tokens stay local. iCloud Drive is eventually consistent, so another Mac may take a moment to appear or update, and a missing or malformed file never clears the last-good aggregate.
App state lives in the OS user-data dir — delete it along with the app to fully uninstall.
| Platform | Path | |---
→ →
→ →
→ →
→ →
→ →
→ →
→ →
→