1
 →

Automated developer-oriented status page with alerting and incident support
TwiN/gatus is an open-source project on GitHub, mainly written in Go. Automated developer-oriented status page with alerting and incident support It currently holds 12,661 stars and 895 forks with 438 open issues, and was last pushed on 2026-11-09 (repository created 2019-09-04).
Git Homed tracks it on the Today's Trending board, currently at rank #45 with 100 new stars today.




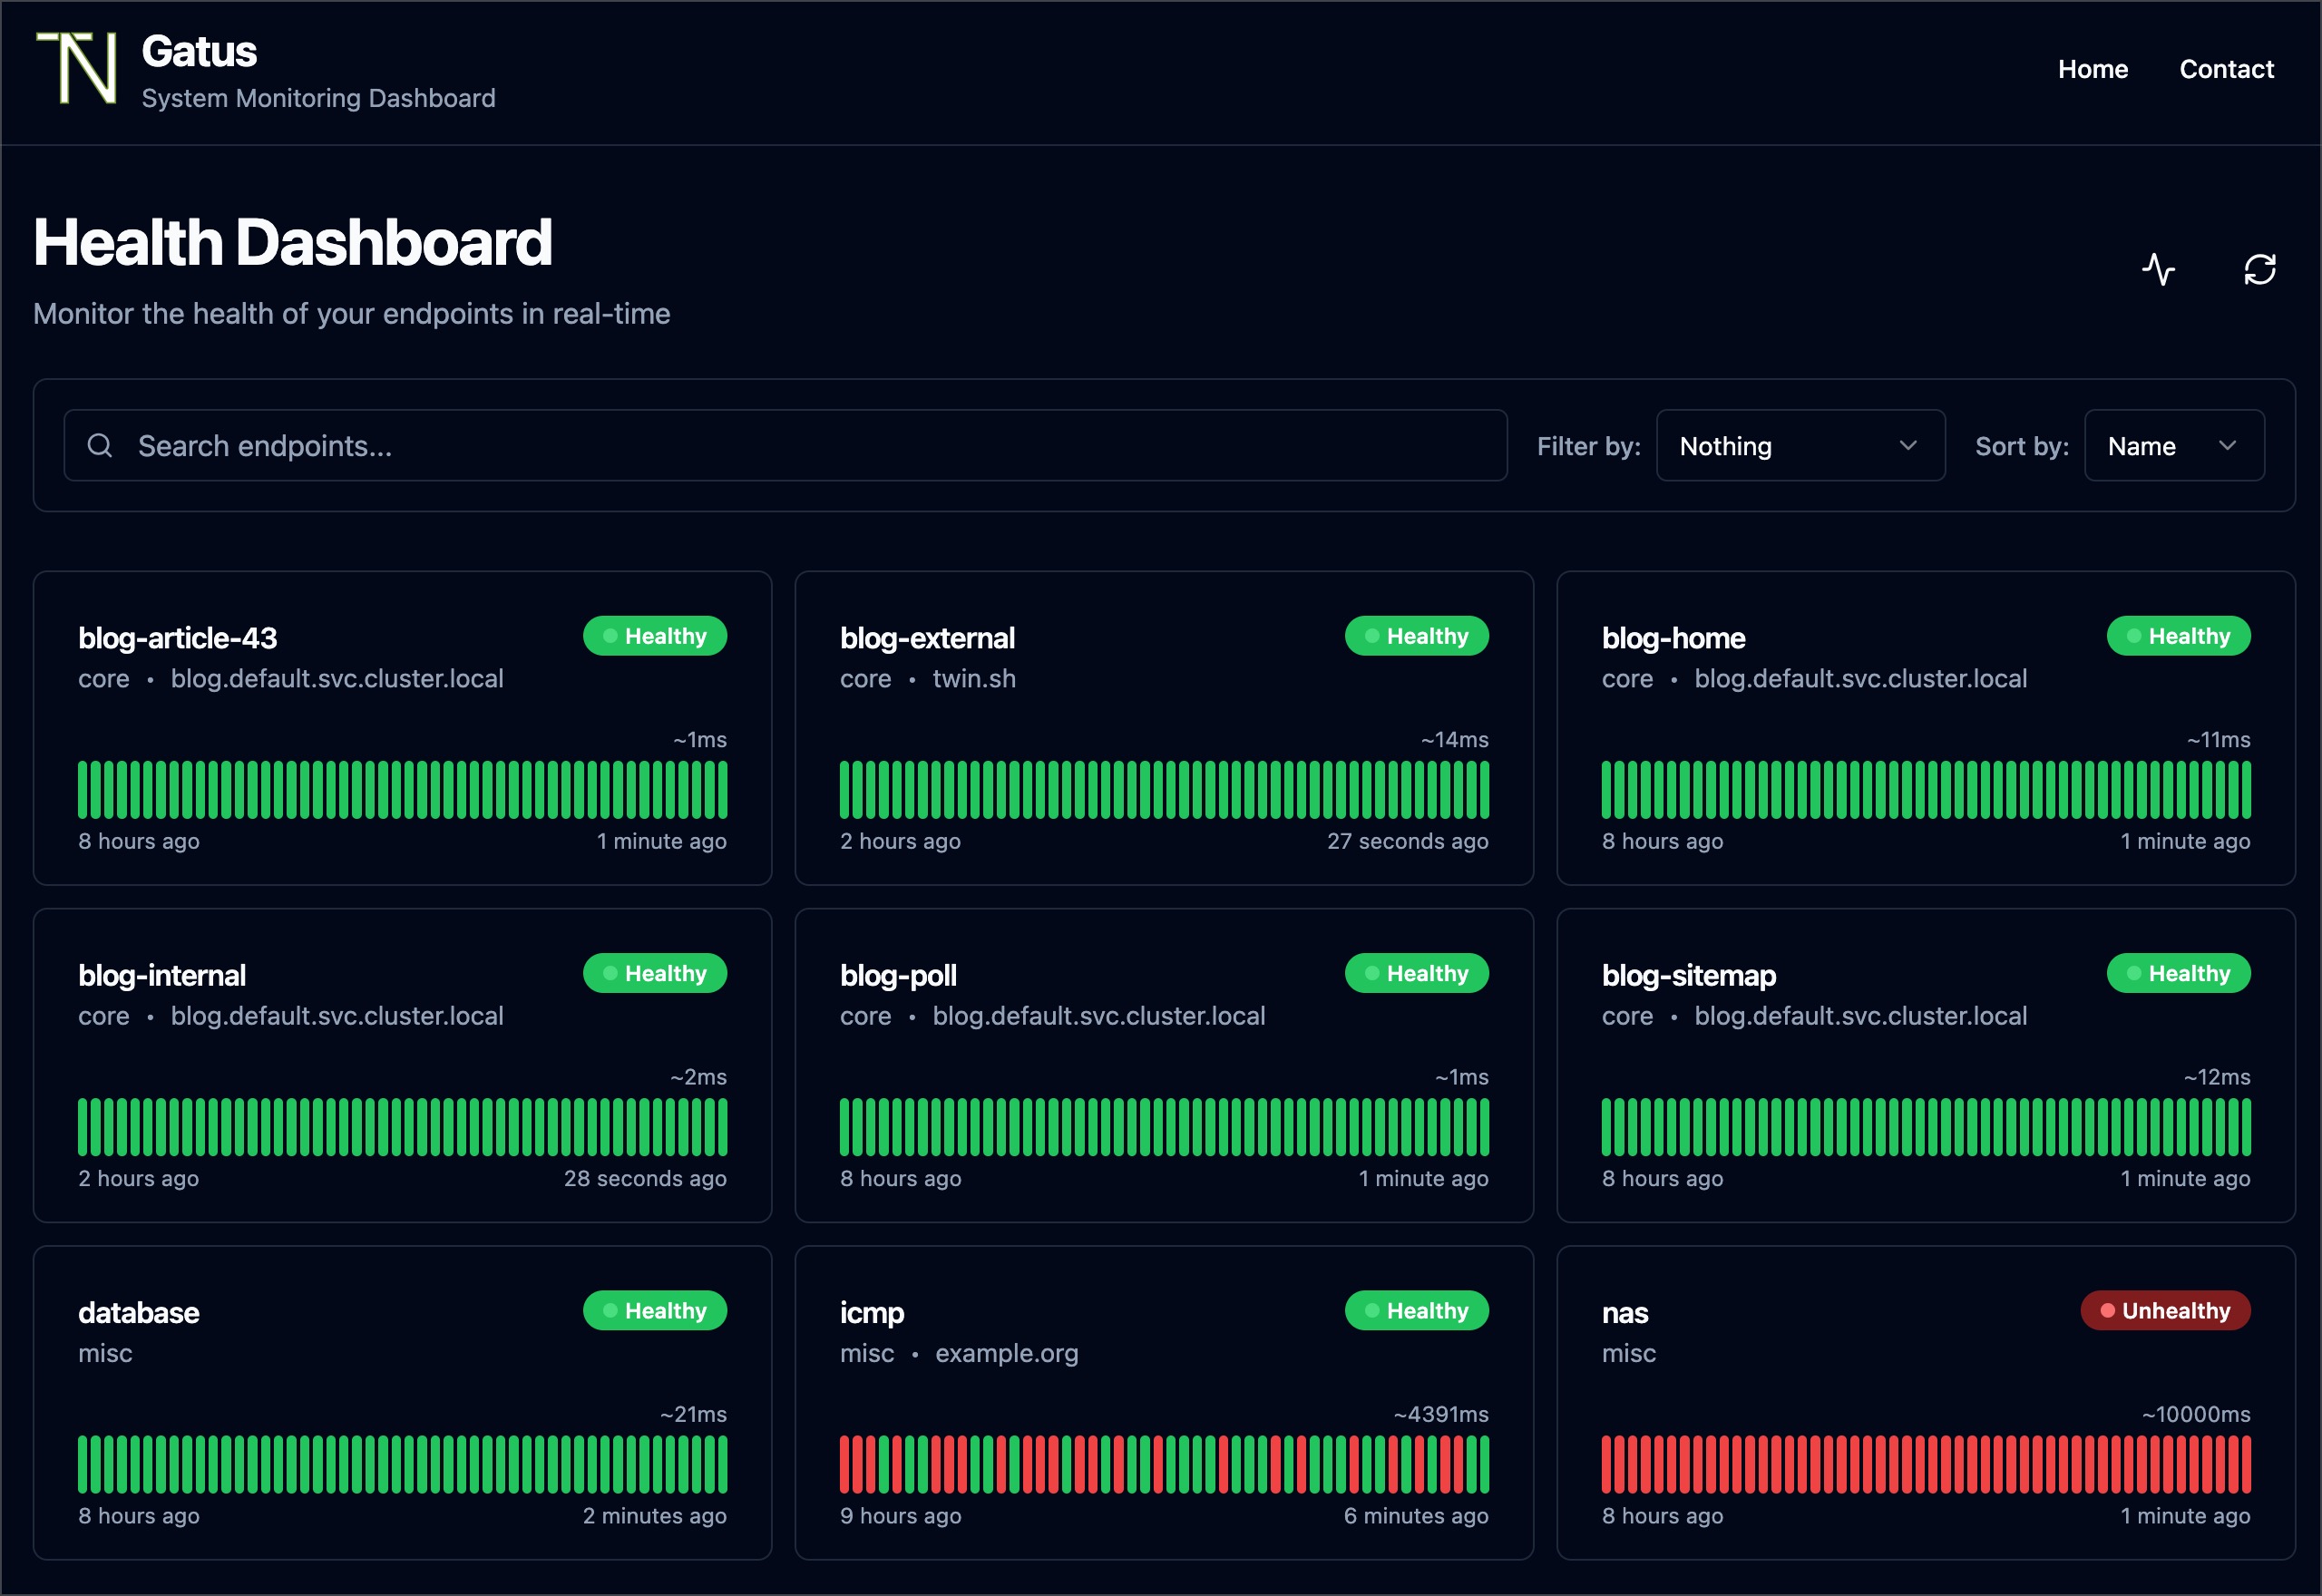
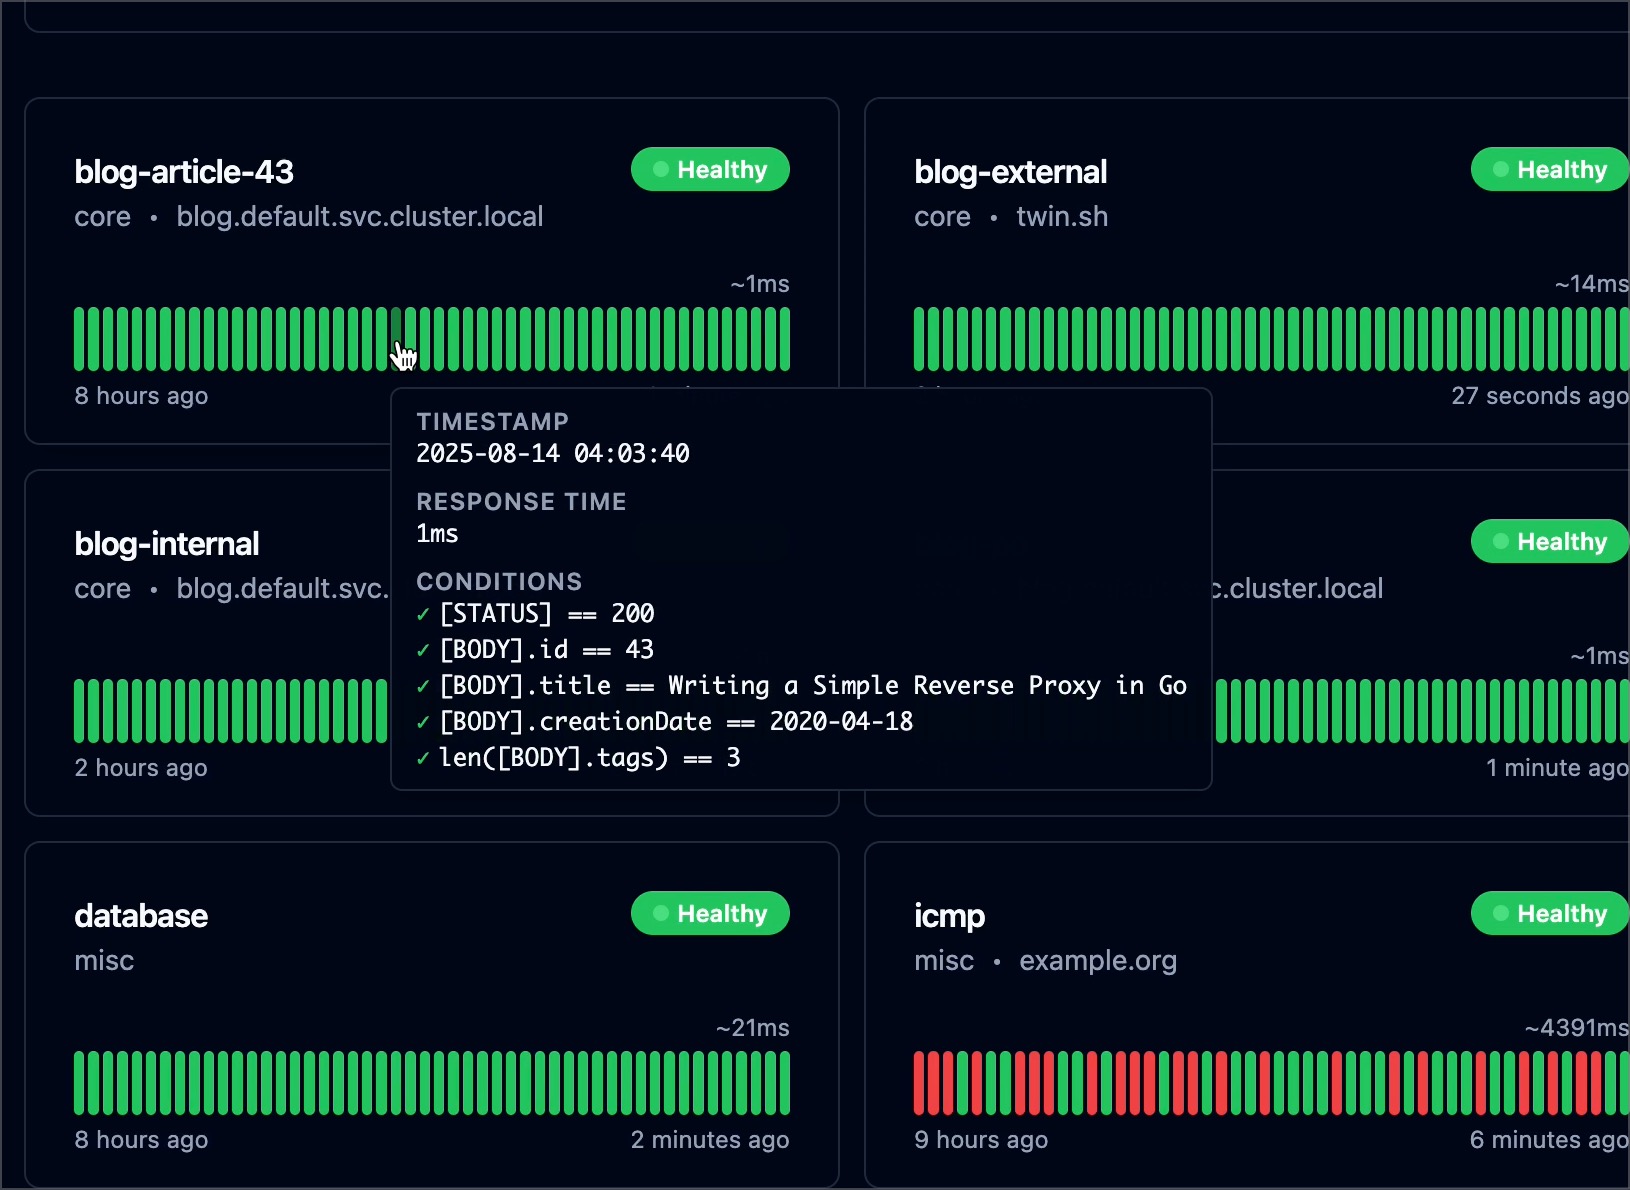
Gatus is a developer-oriented health dashboard that gives you the ability to monitor your services using HTTP, ICMP, TCP, and even DNS queries as well as evaluate the result of said queries by using a list of conditions on values like the status code, the response time, the certificate expiration, the body and many others. The icing on top is that each of these health checks can be paired with alerting via Slack, Teams, PagerDuty, Discord, Twilio and many more.
I personally deploy it in my Kubernetes cluster and let it monitor the status of my core applications: https://status.twin.sh/
_Looking for a managed solution? Check out Gatus.io._
docker run -p 8080:8080 --name gatus ghcr.io/twin/gatus:stable
You can also use Docker Hub if you prefer:
docker run -p 8080:8080 --name gatus twinproduction/gatus:stable
❤ Like this project? Please consider sponsoring me.
Have any feedback or questions? Create a discussion.
Why would I use Gatus when I can just use Prometheus’ Alertmanager, Cloudwatch or even Splunk?
Neither of these can tell you that there’s a problem if there are no clients actively calling the endpoint. In other words, it's because monitoring metrics mostly rely on existing traffic, which effectively means that unless your clients are already experiencing a problem, you won't be notified.
Gatus, on the other hand, allows you to configure health checks for each of your features, which in turn allows it to monitor these features and potentially alert you before any clients are impacted.
A sign you may want to look into Gatus is by simply asking yourself whether you'd receive an alert if your load balancer was to go down right now. Will any of your existing alerts be triggered? Your metrics won’t report an increase in errors if no traffic makes it to your applications. This puts you in a situation where your clients are the ones that will notify you about the degradation of your services rather than you reassuring them that you're working on fixing the issue before they even know about it.


docker run -p 8080:8080 --name gatus ghcr.io/twin/gatus:stable
You can also use Docker Hub if you prefer:
docker run -p 8080:8080 --name gatus twinproduction/gatus:stable
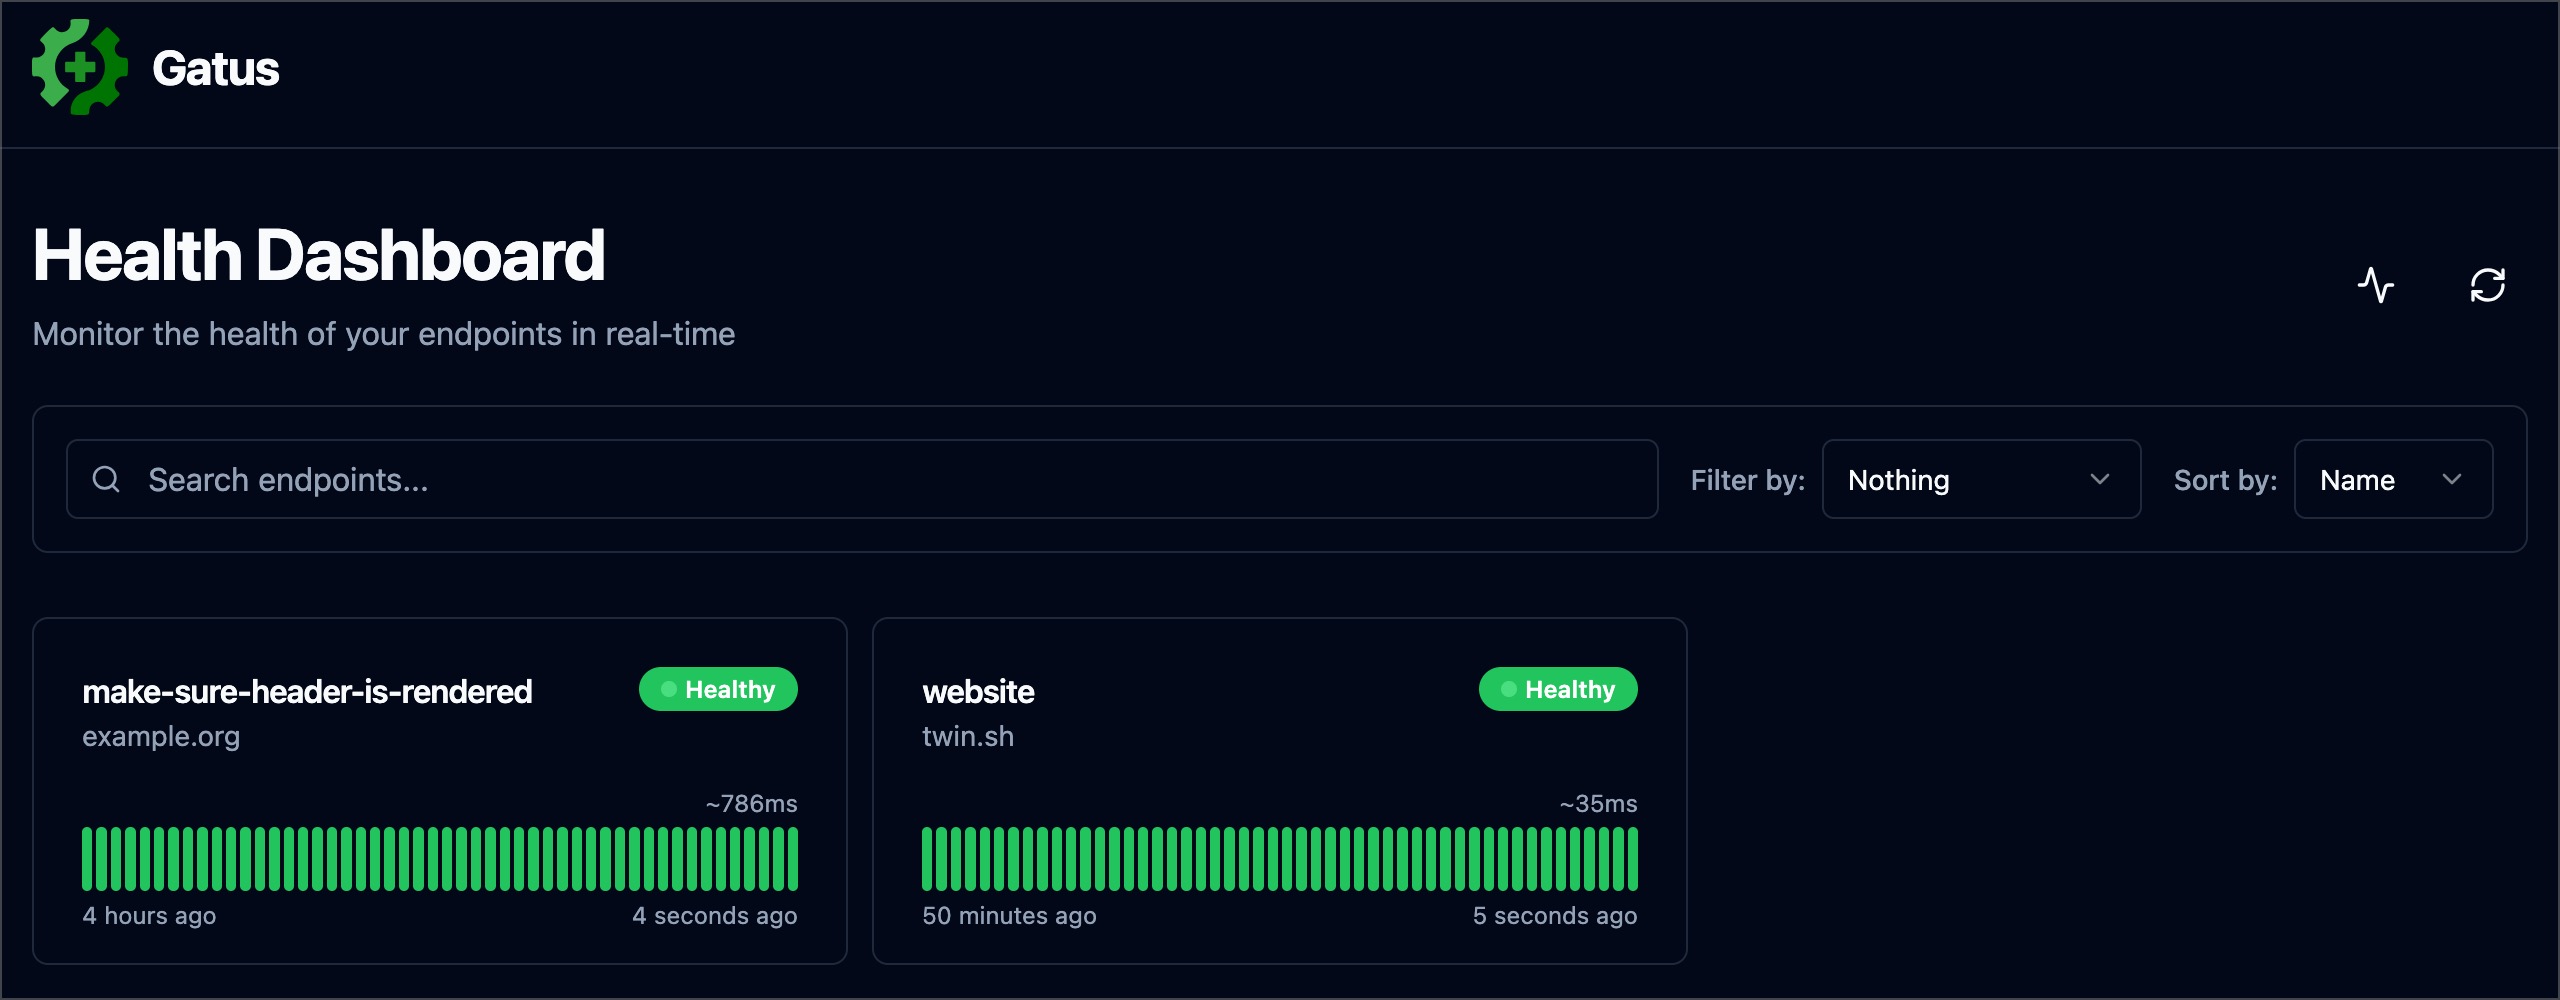
Here's a simple example:
endpoints:
- name: website # Name of your endpoint, can be anything
url: "https://twin.sh/health"
interval: 5m # Duration to wait between every status check (default: 60s)
conditions:
- "[STATUS] == 200" # Status must be 200
- "[BODY].status == UP" # The json path "$.status" must be equal to UP
- "[RESPONSE_TIME] < 300" # Response time must be under 300ms
- name: make-sure-header-is-rendered
url: "https://example.org/"
interval: 60s
conditions:
- "[STATUS] == 200" # Status must be 200
- "[BODY] == pat(
Example Domain
)" # Body must contain the specified header
This example would look similar to this:
If you want to test it locally, see Docker.
config/config.yaml.
You can specify a custom path by setting the GATUS_CONFIG_PATH environment variable.
If GATUS_CONFIG_PATH points to a directory, all .yaml and .yml files inside said directory and its
subdirectories are merged like so:
alerting.slack in one file and alerting.pagerduty in another file)endpoints in multiple files and each endpoint will be added to the final list of endpoints)metrics, alerting.slack.webhook-url, etc.) may only be defined once to forcefully avoid any ambiguityalerting.slack.webhook-url in two files with different values. All files are merged into one before they are processed. This is by design.💡 You can also use environment variables in the configuration file (e.g.$DOMAIN,${DOMAIN})
> ⚠️ When your configuration parameter contains a$symbol, you have to escape$with$$.
> See Use environment variables in config files or examples/docker-compose-postgres-storage/config/config.yaml for examples.
If you want to test it locally, see Docker.
metrics | Whether to expose metrics at /metrics. | false |
| storage | Storage configuration. | {} |
| alerting | Alerting configuration. | {} |
| announcements | Announcements configuration. | [] |
| endpoints | Endpoints configuration. | Required [] |
| external-endpoints | External Endpoints configuration. | [] |
| security | Security configuration. | {} |
| concurrency | Maximum number of endpoints/suites to monitor concurrently. Set to 0 for unlimited. See Concurrency. | 3 |
| disable-monitoring-lock | Whether to disable the monitoring lock. Deprecated: Use concurrency: 0 instead. | false |
| skip-invalid-config-update | Whether to ignore invalid configuration update. false |
| web | Web configuration. | {} |
| ui | UI configuration. | {} |
| maintenance | Maintenance configuration. | {} |
If you want more verbose logging, you may set the GATUS_LOG_LEVEL environment variable to DEBUG.
Conversely, if you want less verbose logging, you can set the aforementioned environment variable to WARN, ERROR or FATAL.
The default value for GATUS_LOG_LEVEL is INFO.
| Parameter | Description | Default |
|:------------------------------------------------|:--------------------------------------------------------------------------------------------------------------------------------------------|:---------------------------|
| endpoints | List of endpoints to monitor. | Required [] |
| endpoints[].enabled | Whether to monitor the endpoint. | true |
| endpoints[].name | Name of the endpoint. Can be anything. | Required "" |
| endpoints[].group | Group name. Used to group multiple endpoints together on the dashboard.
See Endpoint groups. | "" |
| endpoints[].url | URL to send the request to. | Required "" |
| endpoints[].method | Request method. | GET |
| endpoints[].conditions | Conditions used to determine the health of the endpoint.
See Conditions. | [] |
| endpoints[].interval | Duration to wait between every status check. | 60s |
| endpoints[].graphql | Whether to wrap the body in a query param ({"query":"$body"}). | false |
| endpoints[].body | Request body. | "" |
| endpoints[].headers | Request headers. | {} |
| endpoints[].dns | Configuration for an endpoint of type DNS.
See Monitoring an endpoint using DNS queries. | "" |
| endpoints[].dns.query-type | Query type (e.g. MX). | "" |
| endpoints[].dns.query-name | Query name (e.g. example.com). | "" |
| endpoints[].ssh | Configuration for an endpoint of type SSH.
See Monitoring an endpoint using SSH. | "" |
| endpoints[].ssh.username | SSH username (e.g. example). | Required "" |
| endpoints[].ssh.password | SSH password (e.g. password). | Required "" |
| endpoints[].alerts | List of all alerts for a given endpoint.
See Alerting. | [] |
| endpoints[].maintenance-windows | List of all maintenance windows for a given endpoint.
See Maintenance. | [] |
| endpoints[].client | Client configuration. | {} |
| endpoints[].ui | UI configuration at the endpoint level. | {} |
| endpoints[].ui.hide-conditions | Whether to hide conditions from the results. Note that this only hides conditions from results evaluated from the moment this was enabled. | false |
| endpoints[].ui.hide-hostname | Whether to hide the hostname from the results. | false |
| endpoints[].ui.hide-port | Whether to hide the port from the results. | false |
| endpoints[].ui.hide-url | Whether to hide the URL from the results. Useful if the URL contains a token. | false |
| endpoints[].ui.hide-errors | Whether to hide errors from the results. | false |
| endpoints[].ui.dont-resolve-failed-conditions | Whether to resolve failed conditions for the UI. | false |
| endpoints[].ui.resolve-successful-conditions | Whether to resolve successful conditions for the UI (helpful to expose body assertions even when checks pass). | false |
| endpoints[].ui.badge.response-time | List of response time thresholds. Each time a threshold is reached, the badge has a different color.
→ →
 →
 →
 →
 →
 →
 →